
µIB:Photoelectric Effect
(HL only)
|
10 minutes maximum! Can you do it in 5? |
||||||||||||||||
1. The photoelectric effect demonstrates..
|
||||||||||||||||
2. The work function Φ of a metal is defined as:
|
||||||||||||||||
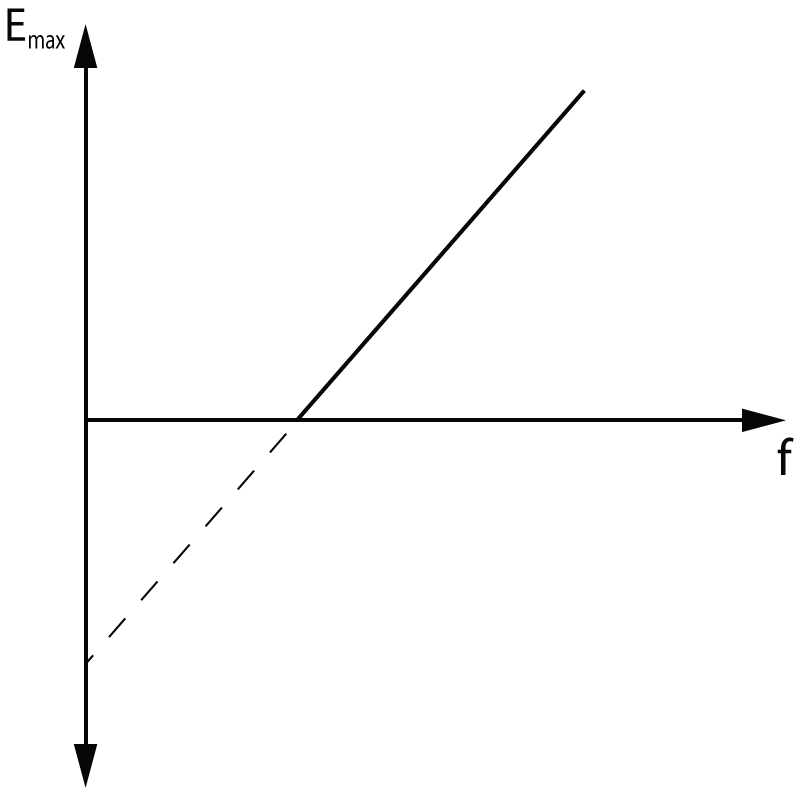
3-5. The graph below shows how the maximum kinetic energy Emax of the electrons varies with the frequency of the incident light on a clean metal surface.
|
||||||||||||||||
3. What is the gradient of this graph?
|
||||||||||||||||
4. What is the Y intercept of this graph?
|
||||||||||||||||
| 5. Which of the following quantities is equal to the threshold frequency? | ||||||||||||||||
| ||||||||||||||||
|
6. Light of wavelength λ is incident on a clean metal sheet, and photoelectrons are liberated with minimal kinetic energy. Which of the following will changes will prevent photoelectrons from being emitted?
|
||||||||||||||||
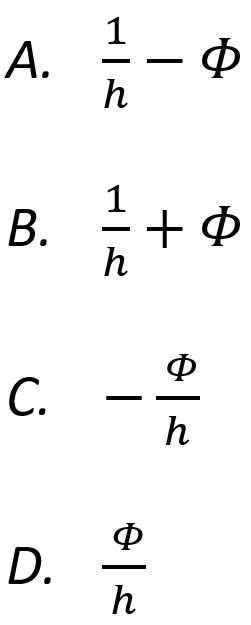
7. Photoelectrons of maximum kinetic energy E are liberated from a metal sheet of work function Φ when photons of frequency f are incident on the metal.
| ||||||||||||||||
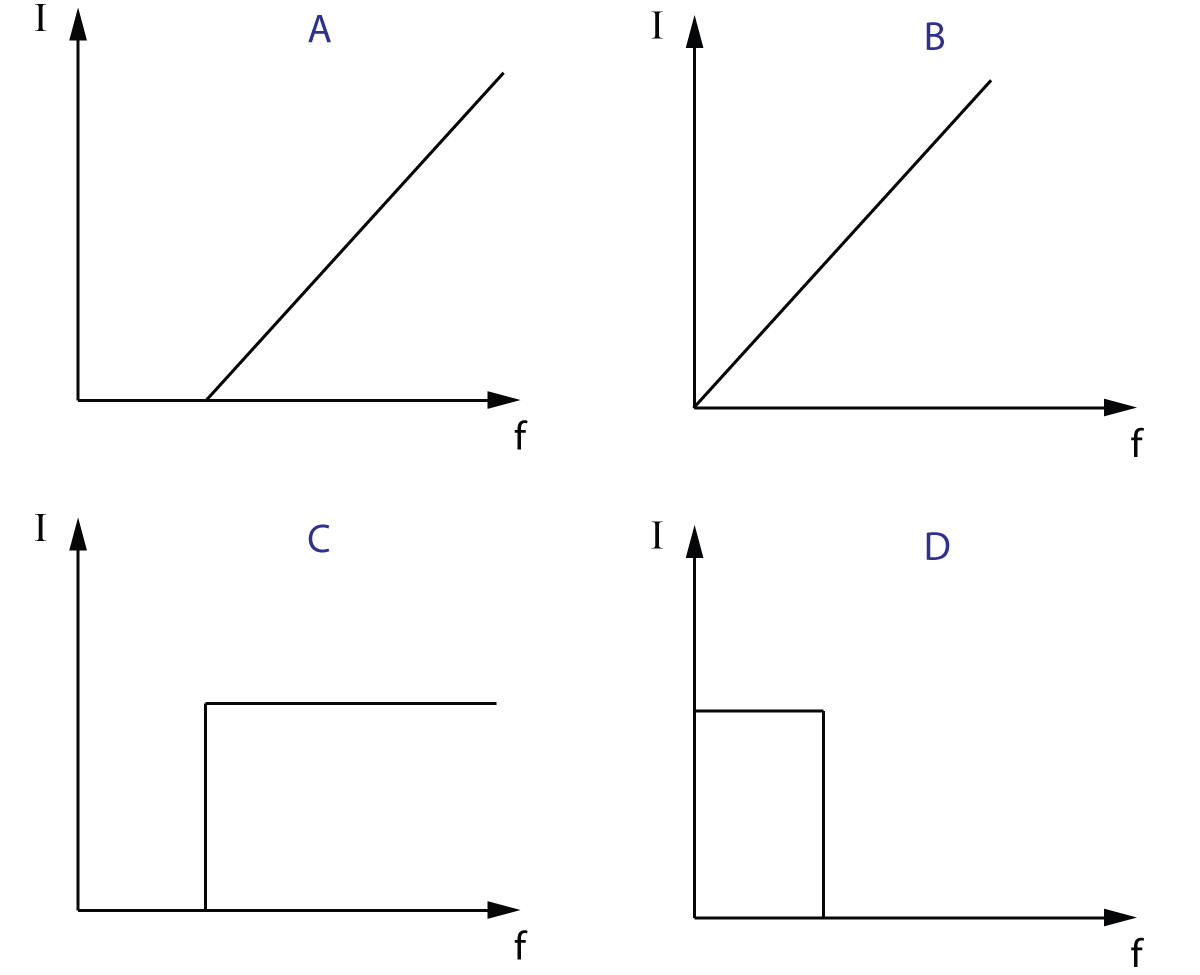
8. Photoelectrons liberated from a metal can produce a current I in an external circuit. The number of photons incident on the sheet is kept constant whilst the frequency f is varied. Which of the following graphs best shows how I varies with f? |
||||||||||||||||
| ||||||||||||||||
9. Which of these observations of the photoelectric effect cannot be explained with a wave model of light?
|
||||||||||||||||
| ||||||||||||||||
10. A student investigates the photoelectric effect on a metal with a fixed work function, using a 60W red light source. They measured the kinetic energy of electons released (Ek) as well as the number of electrons released per second, N. How will these values change if a 60W blue light source is used instead? |
||||||||||||||||
| ||||||||||||||||