
Edexcel IGCSE Heat+Matter
10 quick questions
|
10 minutes maximum! Can you do it in 5? |
||||||||||||||||||
Q1-3. The diagram show particles in 3 states of matter: |
||||||||||||||||||
1. Which of these diagrams shows the particles in a gas and a liquid?
|
||||||||||||||||||
2. Which of these diagrams shows the particles in their hottest and coldest state?
|
||||||||||||||||||
3. In which of these diagrams are the particles held in place, vibrating about a fixed point?
|
||||||||||||||||||
The energy needed to heat up a substance is given by the formula shown here:
|
ΔQ = m c ΔT change in thermal energy = mass x specific heat capacity x temperature change |
|||||||||||||||||
4. This formula should be used when a substance is...
|
||||||||||||||||||
5. Water has a specific heat capacity (c) of 4200 J / Kg 0C. The energy needed to heat 2 kg of water by 5 0C is therefore: |
 |
|||||||||||||||||
|
||||||||||||||||||
6. If I supply 210 kJ of heat to the same 2 kg of water, how much would the temperature increase?
|
||||||||||||||||||
Q 7-9. These questions are about heating different bars of copper. Copper has a specific heat capacity of 800 J / Kg 0C. What are the missing values? |
 |
|||||||||||||||||
|
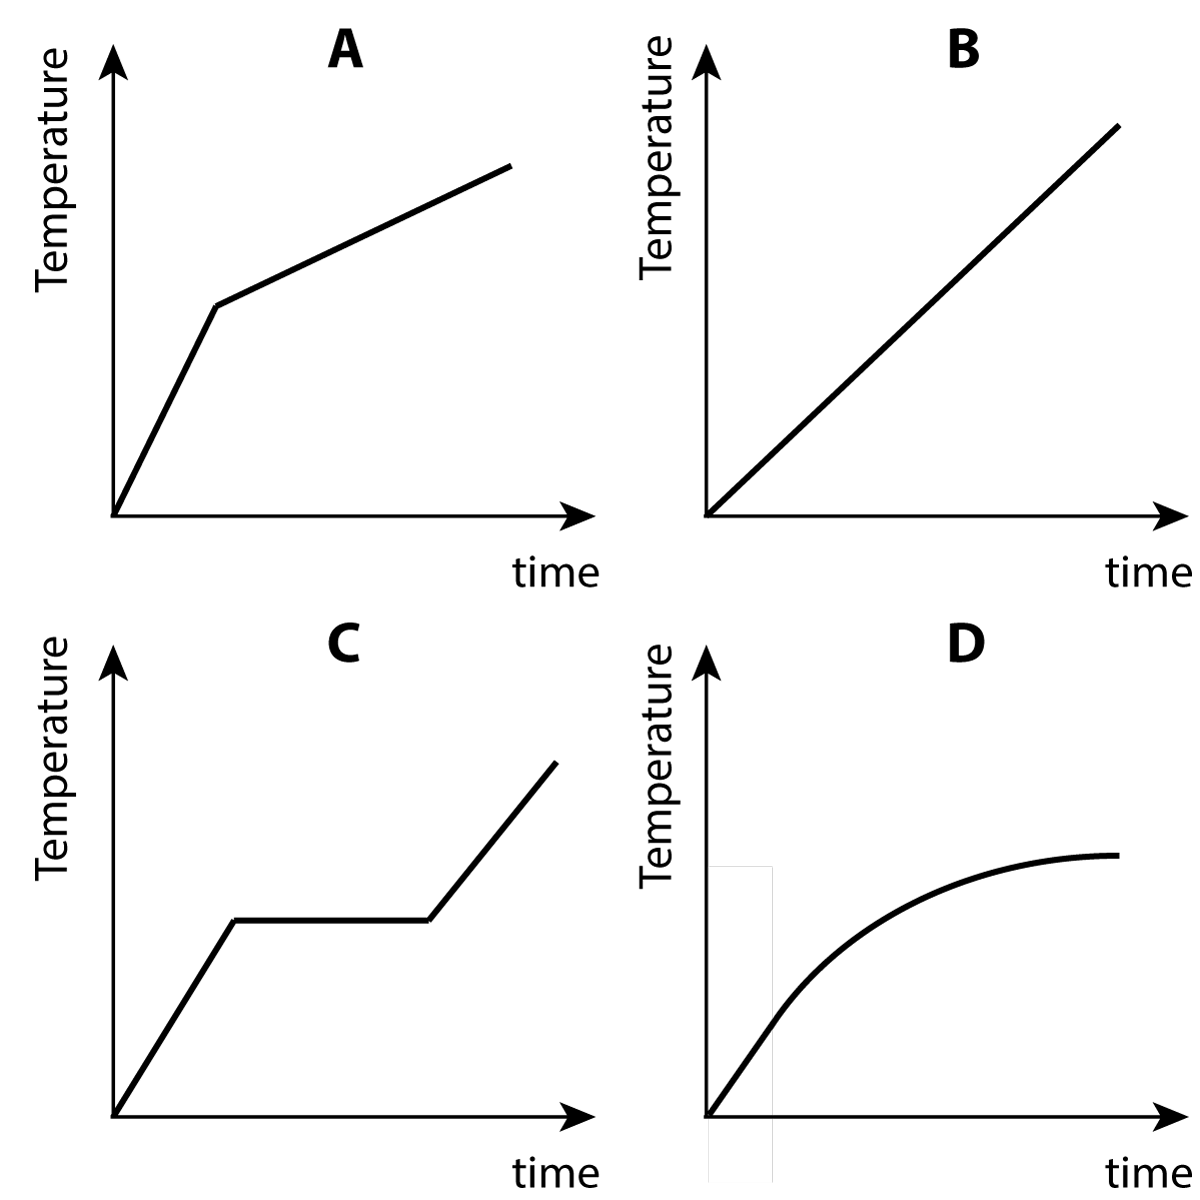
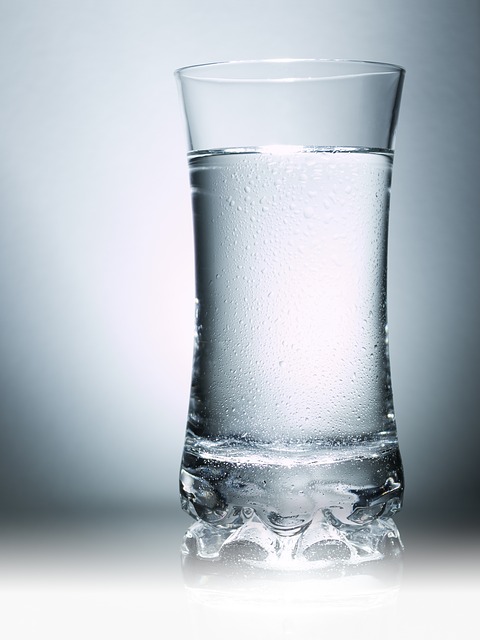
10. When the ice cubes are first taken out of the freezer they are really cold. Which graph best shows the change in temperature as the ice cubes eventually melt and continue to warm up?
|
|||||||||||||||||