
Biology µGCSE:Enzymes
10 quick questions - for GCSE and iGCSE
|
10 minutes maximum! Can you do it in 5? |
|||||||||||||||||||||||||||
1. Where would you find enzymes in a plant cell?
| |||||||||||||||||||||||||||
2. Which types of biological molecule do enzymes belong to?
| |||||||||||||||||||||||||||
3. Enzymes are Biological Catalysts. Which word would you use to complete this sentence? "An enzyme ___________a reaction without being used up".
| |||||||||||||||||||||||||||
The diagram shows a simplified enzyme.
What part of an enzyme is X ? |
 |
||||||||||||||||||||||||||
| |||||||||||||||||||||||||||
5. Which temperature irreversibly changes the shape of the part labelled X?
| |||||||||||||||||||||||||||
6. Which row in this table best describes all enzymes?
| |||||||||||||||||||||||||||
7. The diagram below shows the function of an enzyme:
What do the labels X, Y and Z indicate? |
|||||||||||||||||||||||||||
| |||||||||||||||||||||||||||
8. The graph below shows how the rate of reaction of an enzyme is affected by temperature:
Which of the following best describes labels X and Z on the graph? |
|
||||||||||||||||||||||||||
| |||||||||||||||||||||||||||
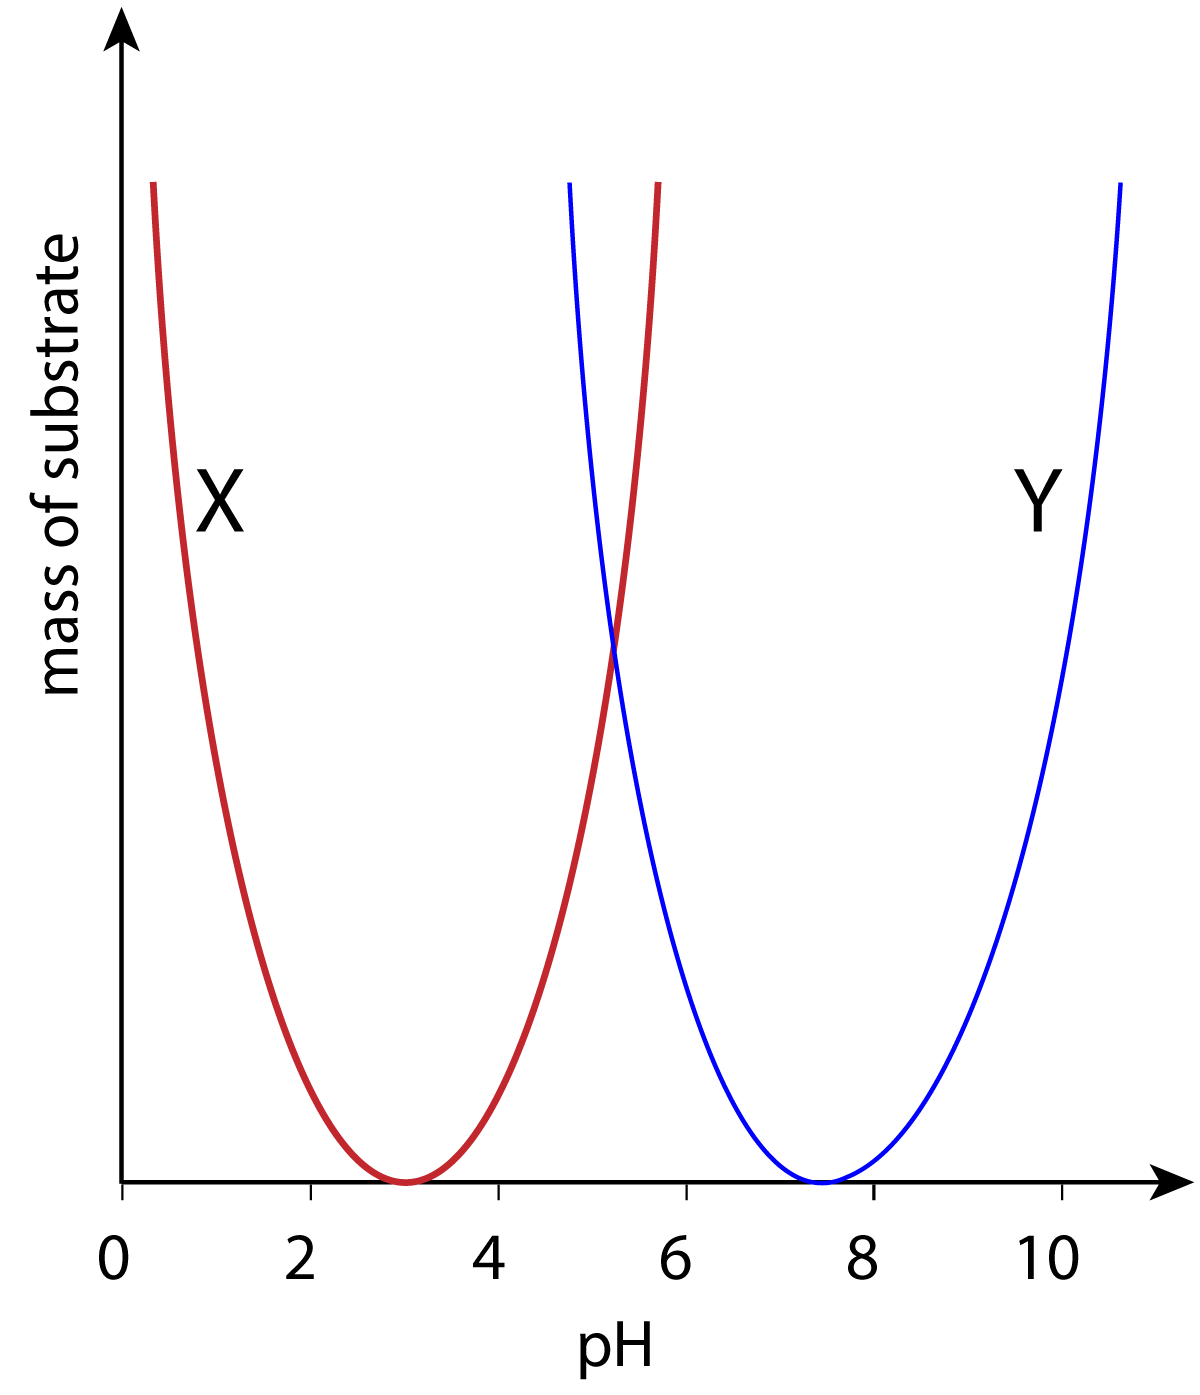
9. Enzymes X and Y are found in different parts of the body. These enzymes function differently in different pH values. The graphs below show the mass of substrate remaining after mixing with the enzyme for a given time.
Where might you find X and Y in the digestive system? |
|
||||||||||||||||||||||||||
| |||||||||||||||||||||||||||
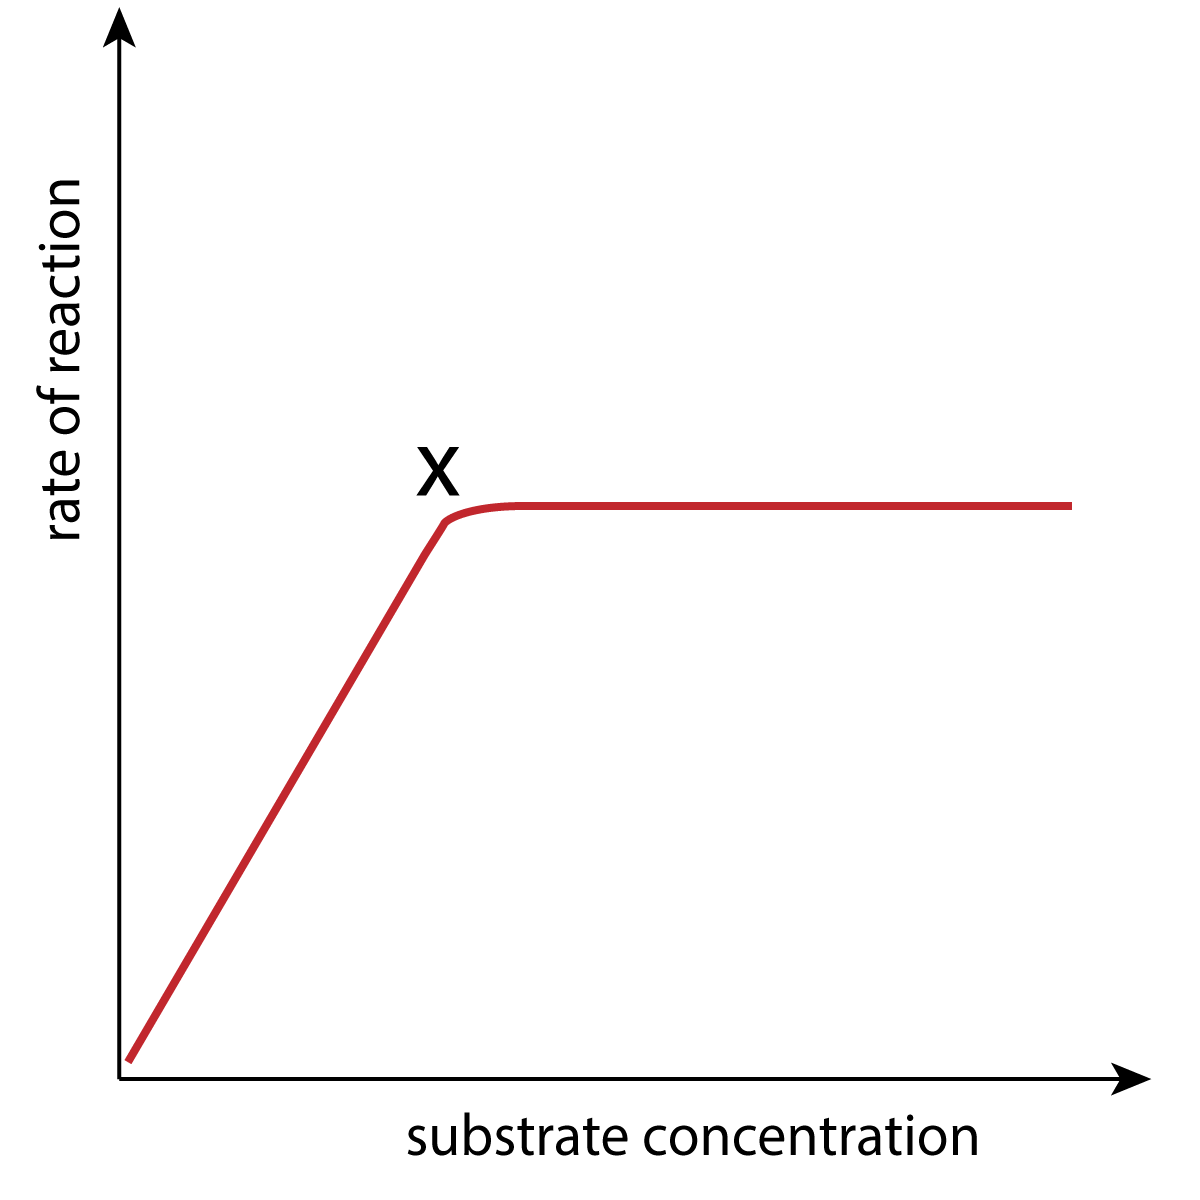
10. The graph below shows how substrate concentration affects the rate of reaction of an enzyme.
To increase the rate of reaction at point X you could... |
|
||||||||||||||||||||||||||
| |||||||||||||||||||||||||||